Information and discussions on Spectrum Analysis
-
SteveAndrew
- Posts: 213
- Joined: Thu Nov 16, 2017 11:06 pm
- Location: Gold Coast, QLD, Australia
Post
by SteveAndrew » Wed Apr 17, 2019 5:32 am
Brian VK6LO wrote:I have indications that Tuner selection on the DUO is 'flaky'
1. Operating with signal input to Tuner 2 displayed then stop the program with Tuner 2 still selected and close the program
2. Restart the analyser and Tuner 1 is now highlighted but the signal from Tuner 2 connection is displayed - select Tuner 2 = no signal displayed
3. Reselect Tuner 1 and signal from tuner 2 displays then select HighZ and signal disappears (correct)
With input still on tuner 2 select 2 and signal may or may not be displayed
It seems that initial program start highlites tuner 1 in the program but does not select tuner 1 in the radio and from then on various combinations of tuner selection may or may not happen correctly
Brian
Hi Brian
Thanks for that. Somebody else has reported a similar problem that also includes MW, BC/FM and DAB filter switching. I've confirmed the problem and I'm working on it now.
Steve
Reason: No reason
-
SteveAndrew
- Posts: 213
- Joined: Thu Nov 16, 2017 11:06 pm
- Location: Gold Coast, QLD, Australia
Post
by SteveAndrew » Wed Apr 17, 2019 6:01 am
glovisol wrote:Hi Steve,
There is a "false start" problem whereby on switch on of a measurement previoulsly set up and OK the Spectrum Analyser comes up wrong, like if it was overloaded. Then, by altering the REF level and going back the SA recovers, as shown in the enclodes pics. Otherwise I have been working for several days with this 1.0a software and it is really a dream!
Kind regards,
Gianfranco
Hi Gianfranco
Many thanks for your detailed reports, they are a great help. That problem has now been fixed. As you say, once the analyser is running, then changing the reference level, then re-selecting the original level will clear the problem.
Steve
Reason: No reason
-
PeterW
- Posts: 8
- Joined: Sat Apr 06, 2019 7:08 am
Post
by PeterW » Fri Apr 19, 2019 10:19 am
When i was testing the AD9850 tracking generator function, I placed it on SPOT frequency 4 MHz and thought i could make a calibration with the dBM trim, but i saw some strange behavior in the signal level in this configuration.
RSP2 Port A ---> Step attenuator 1 to 10dB ---> AD9850 set to 4MHz and output level seem to be fixed, it was -5.8dB measured with a GIgatronics power meter.
Measured level in the RSP Spectrum Analyser with SPAN 2MHz IF-kHz 2048
Peak level @4MHz ATT value Diff value dB
-5.8 dB at 0dB
-6.9 dB at 1dB 1.1
-8.7 dB at 2dB 1.8
-11.5 dB at 3dB 2.8
-14.2 dB at 4dB 2.7
-17.4 dB at 5dB 3.2
-19.7 dB at 6dB 2.3
-21.2 dB at 7dB 1.5
-22.5 dB at 8dB 1.3
-23.6 dB at 9dB 1.1
-25.2 dB at 10dB 1.6
It confused me because both the level and level difference is not even equal over the 0 to 10dB range
and remind me it could be caused of system impedance variations at RSP2 A port
So i connected a 10dB attenuator to the RSP2 A port and Se it look much nicer
-5.8 dB at 0dB
-6.8 dB at 1dB 1
-7.9 dB at 2dB 1.1
-8.9 dB at 3dB 1
-10 dB at 4dB 1.1
-11 dB at 5dB 1
-12 dB at 6dB 1
-13.1 dB at 7dB 1.1
-14.1 dB at 8dB 1
-15.1 dB at 9dB 1
-16.1 dB at 10dB 1
So it means that the A input of RSP2 need a 50 Ohm defined attenuator to measure more accurate, i have not checked B input but i think it is the same.
In the datasheet for RSP it says that the SMA inputs are 50 ohm but this problem shows that it is not ? has any one seen the same ?
//Peter
Reason: No reason
-
g1hbe
- Posts: 494
- Joined: Sat Jan 17, 2015 3:28 pm
- Location: Cheshire, UK
Post
by g1hbe » Fri Apr 19, 2019 3:46 pm
I would guess that like any RX, the '50 ohm' spec is purely nominal and will vary significantly with frequency, particularly when a filter band-edge is crossed.
Reason: No reason
Andy
-
PeterW
- Posts: 8
- Joined: Sat Apr 06, 2019 7:08 am
Post
by PeterW » Sat Apr 20, 2019 9:53 am
g1hbe wrote:I would guess that like any RX, the '50 ohm' spec is purely nominal and will vary significantly with frequency, particularly when a filter band-edge is crossed.
Yes, but in this example i have a steady Frequency at 4MHz , only changing attenuation , I have not checked but i also think that this problem can be on the AD9850 board as well, that output could be sensitive to different load levels.
I was wonder if any other had seen this before.
BR
Peter
Reason: No reason
-
srr00
- Posts: 3
- Joined: Mon Apr 22, 2019 8:28 pm
Post
by srr00 » Mon Apr 22, 2019 8:44 pm
Hello Steve,
thanks for investing your time in this nice piece of software! I tested it with a RSP2 with SMA A and SMA B terminated with a 50 Ohm load to make the inputs as quiet as possible. I noticed that on the boundaries of the filters at 250Mhz and 420Mhz are big steps in the spectrum plots. Is the noisefloor level of the input circuit that different between the differnt zones ot the input/filter circuits? If i repeat this tests with a noise generator the steps are not that big but still about 20 db high
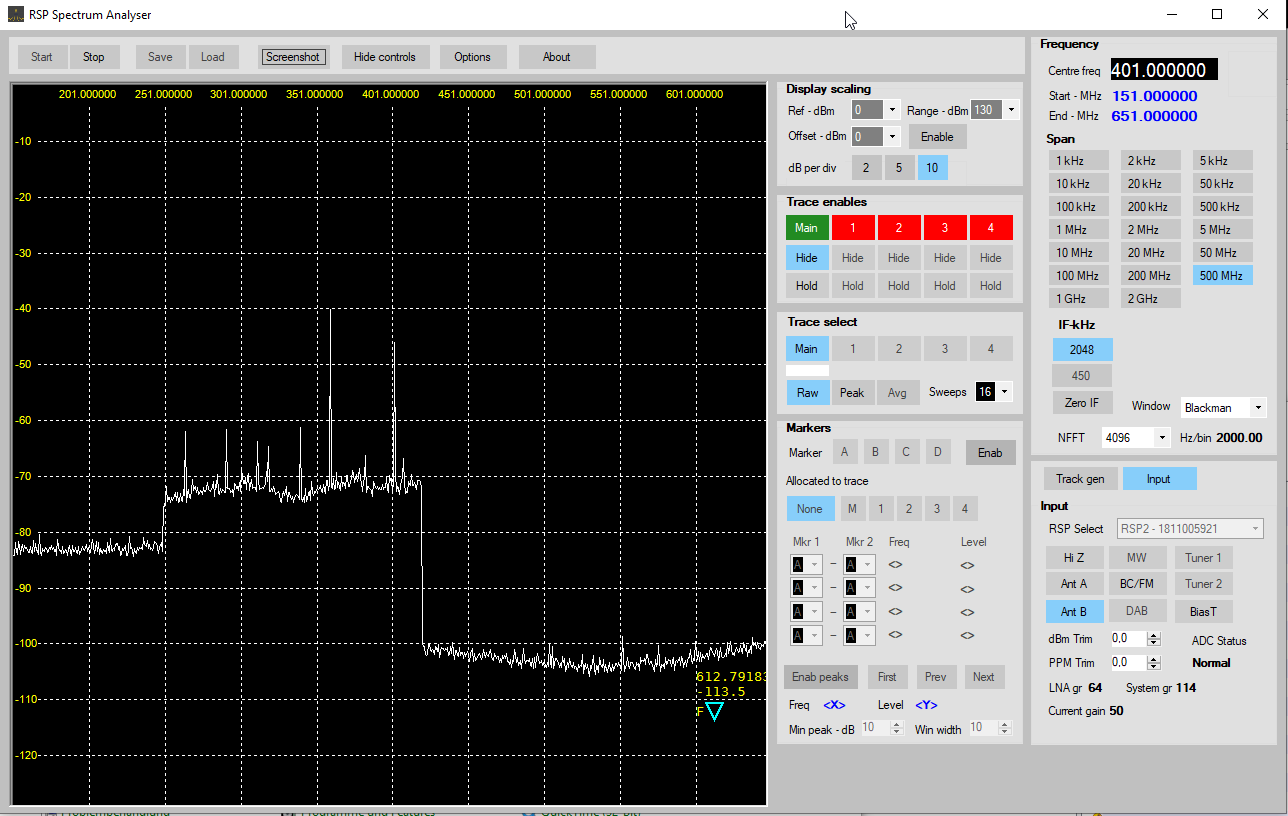
- rsp2.png (61.06 KiB) Viewed 135704 times
Is there a way to calibrate the diffent gain settings of the input circuits of each zone?
many thanks and greetings
robert
Last edited by
srr00 on Thu Jan 01, 1970 12:00 am, edited 0 times in total.
Reason: No reason
-
SteveAndrew
- Posts: 213
- Joined: Thu Nov 16, 2017 11:06 pm
- Location: Gold Coast, QLD, Australia
Post
by SteveAndrew » Tue Apr 23, 2019 12:26 pm
srr00 wrote:Hello Steve,
I noticed that on the boundaries of the filters at 250Mhz and 420Mhz are big steps in the spectrum plots. Is the noise floor level of the input circuit that different between the different zones of the input/filter circuits? If i repeat this tests with a noise generator the steps are not that big but still about 20 db high
Is there a way to calibrate the diffent gain settings of the input circuits of each zone?
many thanks and greetings
robert
Hi Robert
There is a known bug where at startup where the gains are not set correctly. Try changing the reference to another level, and then change it back to the original setting. This should now set the required LNA and IF gains (or more correctly, the gain attenuation) required for the selected reference level. Once this has been done, gains should now be correct for all reference levels. There will still be a change in the noise floor level as a sweep crosses a band boundary, but nowhere near the change in level shown on your screenshot.
It is not possible to calibrate the gain settings for each frequency band. Let us know if the above cures the problem.
Steve
Reason: No reason
-
srr00
- Posts: 3
- Joined: Mon Apr 22, 2019 8:28 pm
Post
by srr00 » Tue Apr 23, 2019 6:38 pm
Hello Steve,
I am not sure if I got it right. I played around with the Ref-dBm-Setting and dht dBm Trim: changed it to a different value (e.g. 10) and changed it back to 0. The effect of the change was visible in the curve immidiatly. After changing it back in the next scan the same curve as shown in the screenshot was displayed again.
When i feed a noise from a noise generator into the rsp2 a diffent curve is shown up. Anyway its still a big step visible at 420 MHz.
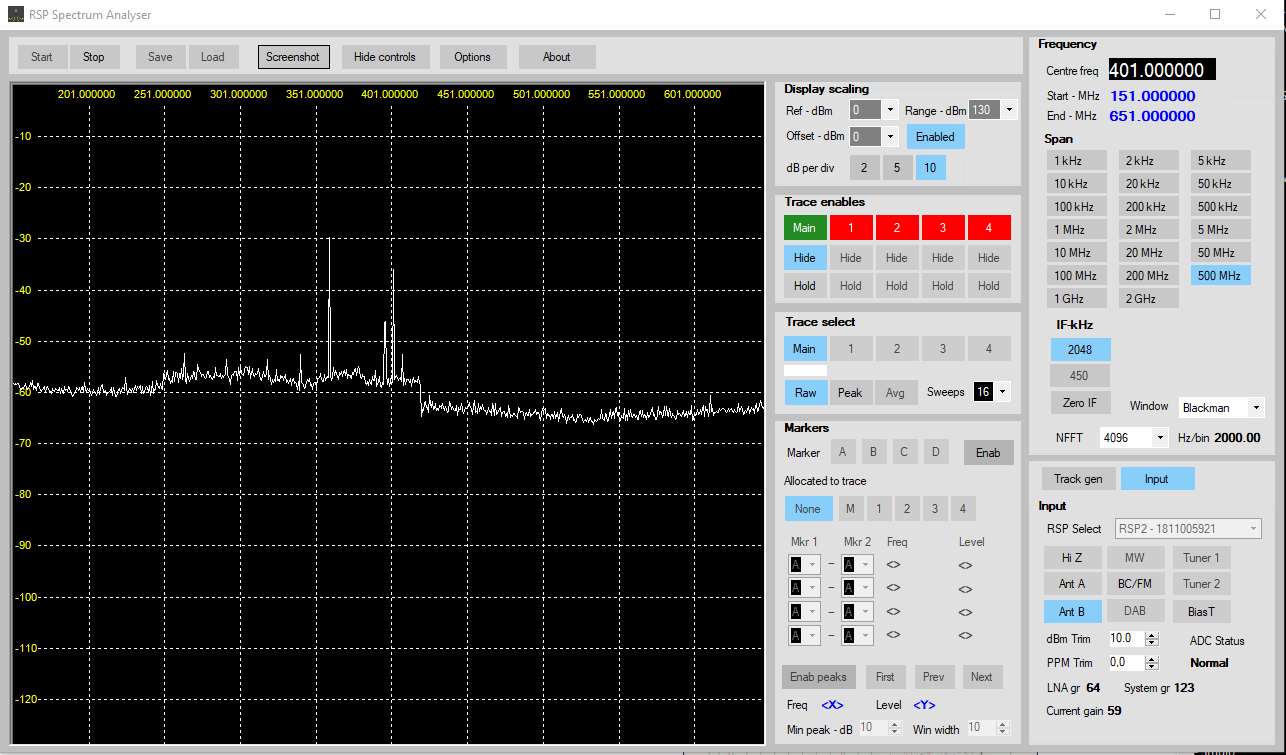
- rsp2-noise-generator.png (56.73 KiB) Viewed 135658 times
If I scroll thru the same signal with SdrUno there is a diffence in gain in the Spectrum-View of maximum 5 dBm in the range between 200 MHz and 450MHz.
regards
Robert
Last edited by
srr00 on Thu Jan 01, 1970 12:00 am, edited 0 times in total.
Reason: No reason
-
SteveAndrew
- Posts: 213
- Joined: Thu Nov 16, 2017 11:06 pm
- Location: Gold Coast, QLD, Australia
Post
by SteveAndrew » Wed Apr 24, 2019 11:30 pm
srr00 wrote:Hello Steve,
I am not sure if I got it right. I played around with the Ref-dBm-Setting and dht dBm Trim: changed it to a different value (e.g. 10) and changed it back to 0. The effect of the change was visible in the curve immidiatly. After changing it back in the next scan the same curve as shown in the screenshot was displayed again.
Hi Robert
Ref-dBm is the only control that directly affects the RSP gain. The dBm Trim just adjusts the displayed level.
srr00 wrote:
When i feed a noise from a noise generator into the rsp2 a diffent curve is shown up. Anyway its still a big step visible at 420 MHz.
If I scroll thru the same signal with SdrUno there is a diffence in gain in the Spectrum-View of maximum 5 dBm in the range between 200 MHz and 450MHz.
This is because the analyser does not use AGC, SDRuno does, unless you have disabled it. Try the same test with SDRuno's AGC turned off.
Steve
Reason: No reason
-
srr00
- Posts: 3
- Joined: Mon Apr 22, 2019 8:28 pm
Post
by srr00 » Fri Apr 26, 2019 3:26 pm
Hi Steve,
thanks for your reply. I switched off the AGC-Function in SDR Uno but it seems its doing some kind of AGC anyway when crossing the Filter Boundaries cause the RF-Gain Slider is changing by its own.
So my test was not valid i think.
Regards Robert
Last edited by
srr00 on Thu Jan 01, 1970 12:00 am, edited 0 times in total.
Reason: No reason